Call Us

We are ready to help

Request a special version

Didn't find what you were looking for?
This field cannot be empty.
This field must be at least 3 characters long.

Files

Drag & Drop files here or click to browse

File format supported: (.pdf, .zip, .docx, .png, .jpg .xlsx, .xls, .csv, .txt) & Max Filesize: 25mb

Need to be uploaded up 1 to 3 files.
File format supported: (.pdf, .zip, .docx, .png, .jpg .xlsx, .xls, .csv, .txt) & Max Filesize: 25mb
Leave your details so we can contact you
This field cannot be empty.
This field must be at least 3 characters long.
This field cannot be empty.
Please enter a valid email address.
This field cannot be empty.
Please enter a valid phone number.
This field cannot be empty.
Server error. Try again later.
Thank you!
We will send you a confirmation email and will contact you soon.
Don't have account yet? Register
Back to shopping

Sensors::Accuracy

In measurement technology, accuracy is defined as the degree of agreement between the displayed (measured) and the "correct" value.

In the International Dictionary of Metrology (VIM), accuracy is defined as:

"Extent of approximation of a measured value to a true value of a measured quantity"

A measuring device (a sensor, a display device) is considered accurate if it has a high degree of measurement precision and a high degree of measurement trueness.

The "measurement accuracy" is not a quantity and is not expressed quantitatively. A measurement is "more accurate" if it has a smaller measurement deviation.

The "measurement trueness" is also not a quantity. With a high degree of measurement accuracy, systematic errors and absolute deviations are small.

The "measurement precision" describes the "degree of agreement of indications or measured values ​​obtained by repeated measurements on the same or similar objects under given conditions" (VIM, Dictionary of Metrology).


Measurement uncertainty

The measurement uncertainty describes the spread of the measured values. The measurement uncertainty can be characterized, for example, by a standard deviation (or by multiples of the standard deviation). In general, however, it also includes systematic errors, such as the deviation from standards. The determination method A for measurement uncertainty uses statistical methods that are carried out with values ​​under certain "repeat conditions" (e.g. by repeated measurements on the same object, with the same machine operator, at the same location, etc.).

All (statistical) components that cannot be assigned to determination method A are assigned to determination method B. These are based on information, e.g. on experience, on technical data from a calibration certificate, on the accuracy class of a tested measuring device, on drift, etc.

The "standard measurement uncertainty" is a measurement uncertainty that is determined as a standard deviation.

The relative standard measurement uncertainty describes the standard deviation divided by the absolute value of the measured value and is usually given as a percentage.


Accuracy class

according to VIM, Dictionary of Metrology:

"Class of measuring instruments or measuring systems that meet specified metrological requirements designed to ensure that the measurement errors or instrument measurement uncertainties remain within specified limits under specified operating conditions."

The accuracy class is generally indicated by a (positive) number, or by a sign or symbol.

The accuracy class is therefore used to compare similar sensors, as a summary (and greatly simplified) selection criterion.

For force and torque sensors, the following properties are used to classify them into an accuracy class:

  • relative standard measurement uncertainty
  • relative linearity deviation and hysteresis
  • temperature-related drift of the zero signal
  • temperature-related drift of the slope of the characteristic curve


Example load cell KM40

The KM40 load cell is specified in the data sheet with an accuracy class of 0.5.

The relative standard measurement uncertainty is determined, for example, by the standard deviation, especially when more than 10 measurements were performed.

When calibrating a sensor, three series of measurements are usually carried out, increasing the force in 5 steps or 10 steps, for example, to determine the repeatability and linearity deviation.

The repeatability or "range" brv is determined as the maximum difference between the output signals at the same force in the same installation position, based on the average output signal reduced by the zero signal in the installed state. brv is a measure of comparability.

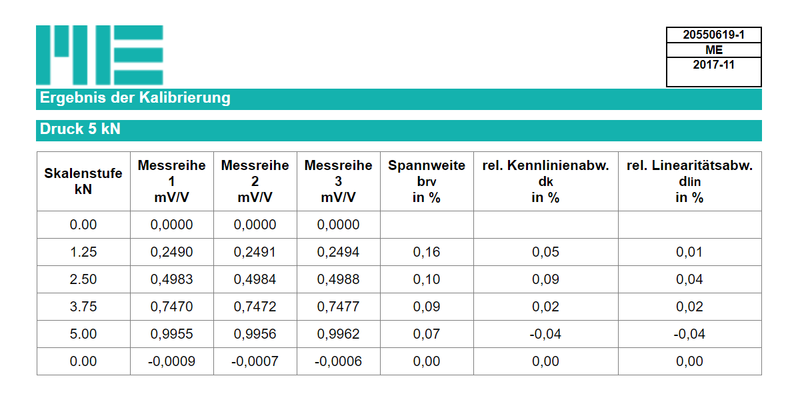
Fig. 1: Result of the calibration of a load cell KM40 5 kN

The data sheet for the KM40 load cell indicates an accuracy class of 0.5. In the present (representative) example, the range at 25% of the nominal load is 0.16% of 1.25 kN (of the actual value). Since the standard deviation cannot be calculated due to the small number of measured values, the amount of the difference between the maximum and minimum value of the three measured values ​​is calculated in the calibration protocol, related to the actual value and shown as a percentage.

The KM40 force sensor can be classified into accuracy class 0.2 due to the range of 0.16% at the load level of 25%.

Another criterion for classification is the relative linearity deviation. At 0.04%, this is also significantly smaller than the accuracy class 0.2. The relative linearity deviation describes the maximum deviation of a force transducer characteristic curve determined with increasing force from the reference line, based on the final measuring range value used.

To determine the hysteresis, calibration would be required with increasing and decreasing load. A special case of hysteresis is the zero point return error (at 0% load). This is shown in the present calibration record and is less than 0.00% (beginning and end of the measurement series). Since the force sensor is made of high-strength spring steel, a systematic error is usually responsible for the hysteresis, e.g. the use of linear guides, insufficiently ground contact surfaces for the force sensor, storage of spring energy in accessories for force introduction, etc.

The temperature-related drift of the slope depends on the properties of the spring steel (decrease in the modulus of elasticity with increasing temperature) and on the properties of the strain gauge (increase or decrease in the k-factor with increasing temperature). These properties are known as systematic influences and are compensated well below 0.2%/10°C and therefore only need to be measured as part of a type approval or can even be derived from the technical data of the strain gauge.

For the force sensor to be classified in accuracy class 0.5, the temperature-related drift of the characteristic value (the gradient) should be less than 0.5%/10°C.

The temperature-related drift of the zero signal must be measured and compensated for each sensor individually.

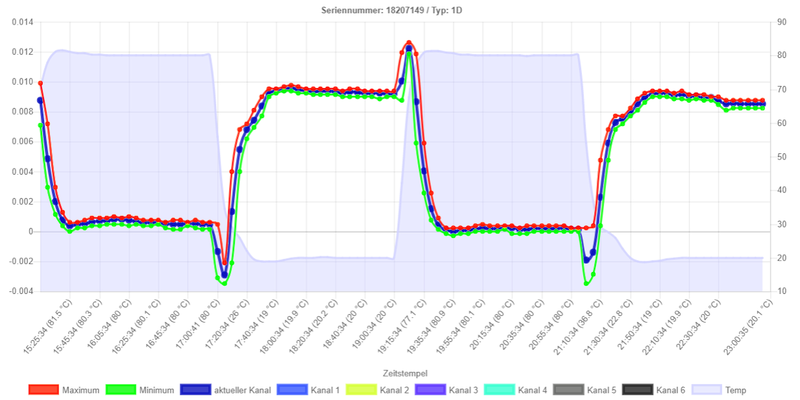
Fig. 2 shows the temperature-related drift of the zero signal for a KM40 5kN sensor:


Abb. 2: temperaturbedingte Drift des KM40 5kN SN18207149 zwischen 20°C und 80°C

Fig. 3: Measurement of the temperature-related drift of the zero point of the KM40 5kN.

For a force sensor to be classified in accuracy class 0.5, the temperature-related drift of the zero signal over a temperature range of 10°C should be less than 0.5% of the sensor's characteristic value.

With a characteristic value of 1 mV/V (FS, "Full Scale"), this means a maximum drift of 0.005 mV/V / 10°C.

In Fig. 2 and Fig. 3 the drift per 60°C is shown. For the present force sensor the drift is 0.00838 mV/V/60°C = 0.0014 mV/V/10K = 0.14% FS/10K

bars-filter